Interactive content: Elements not including Python#
To add interactivity to the book, you can make use of interactive elements which are embedded in the book. You’ve a few options:
Admonition: question provided in normal markdown language with answers in a drowdown menu. There’s no feedback delivered to the student, only the correct answer no matter what the student’s thinking/work.
JupyterQuiz: code-based implementation of multiple-choiche questions and numerical answer questions. This is a basic open course tool which requires you to write your quiz questions in Python language as a
dictor to a.jsonfile.H5p: TU-Delft-licensed tool to create questions (and many other interactive elements) using an online GUI. These elements are embedded into the book using an iframe which requires very little coding. This elements are easier to implement than the JupyterQuiz and have more features (although proper numerical answer questions are missing). More information on this is provided in this subchapter
Grasple-exercises: TU-Delft-licensed tool to creating math-based quiz questions. Again, these elements are embedded into the book using an iframe which requiries very little coding. These elements are very well suited to math-based problems as it allows analytical evaluation of numerical values and formulas. Furthermore, Grasple allows parameterization (not required for formative exercises). More information on this is provided in this subchapter
Custom HTML/Javascript widgets: You can create and embed html/javascript widgets, an example is shown in this subchapter
HTML/Javascript widgets using Plotly. The use of the plotly package is an example which allows you to create HTML/Javascript widgets from python code without any knowledge on HTML/Javascript.
Examples of each type is shown below based on the following problem:
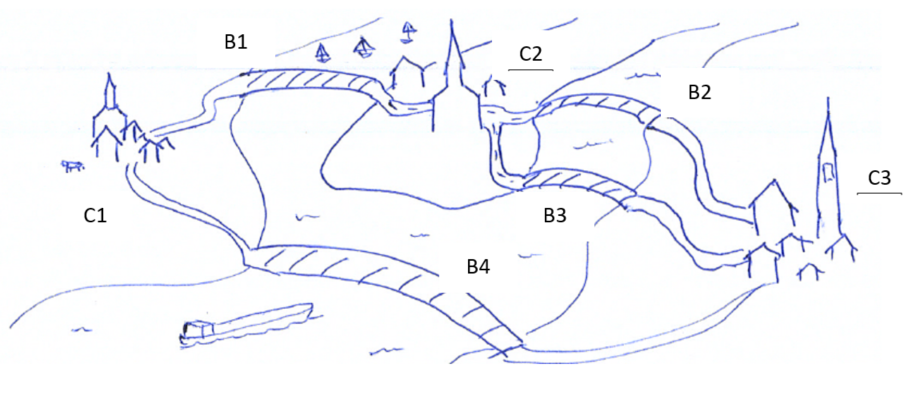
A pre-fabricated bridge design is being considered for river crossings in a remote region of the world, as shown in Figure 1. Cities 1, 2 and 3 are labelled C1, C2 and C3, with bridges labelled B1-B4.

Admonition#
If the probability of failure for an individual bridge is 0.1 per year, compute the probability that you cannot drive from City 1 to City 2
Answer
JupyterQuiz#
H5p#
Grasple#
HTML/Javascript#
The example below shows a custom HTML/Javascript element
Plotly graph#
The example below is taken from the FEM-module by Frans van der Meer. When using Plotly graphs, make sure the notebook is executed in Jupyter Lab / Jupyter Notebook for the figures to be shown in the book. Running the code in VS code might break the result in the book, although the output is visible in VS code. Alternatively, add the following lines of code to your notebook to have a valid output in the book as well:
import plotly.io as pio
pio.renderers.default = 'notebook'